When you think of “Big Data,” you think of the enormous data sets amassed by Amazon, Apple, Netflix, and others to anticipate what you’re likely to buy, how and where you use your devices, and what you want to watch.
Big Data is more than being big. Big Data includes any sprawling, multi-source data set that relates to business transactions and human interactions.
As a manufacturer, you also have Big Data opportunities to expand your business intelligence. TwinEngines develops digital tools to bring multiple stakeholders and sources of data together for manufacturers – CRM, shop floor, ERP, bar codes, field reps, and more. As a result, your “Big Data” lives all over the place, including Excel spreadsheets, cloud-based services, or onsite in various data warehouses.
In the past, if you wanted to run a report, you might have selected a ready-to-run report designed in Crystal Reports (or similar) to print out paginated lists of customers, orders, inventory, stock on hand, etc. If you had more targeted queries, you would construct Boolean search terms or build custom spreadsheets.
The next generation of queries involved analytic tools like IBM Cognos Analytics, Oracle Hyperion, Business Objects, and others. But even these complex searches typically drew from a single data source.
Today’s business intelligence needs to pull from multiple sources to see the big picture. Microsoft’s Power BI offers this capability.
Business Intelligence with Power BI
Power BI is a collection of software services, apps, and connectors that turn unrelated data sources into interactive insights. Power BI lets you connect to your data sources, discover what’s important, and share those insights visually with your team.
More than an app
Power BI is a collection of tools that deliver business intelligence from anywhere and to everywhere:
- Power BI Desktop – This Windows app lets you connect to many different data sources and combine them into a data model. (You can install the app for free from your Windows search bar).
- Power BI Service – This cloud-based platform allows teams and organizations to collaborate and uncover business insights through dashboards and more.
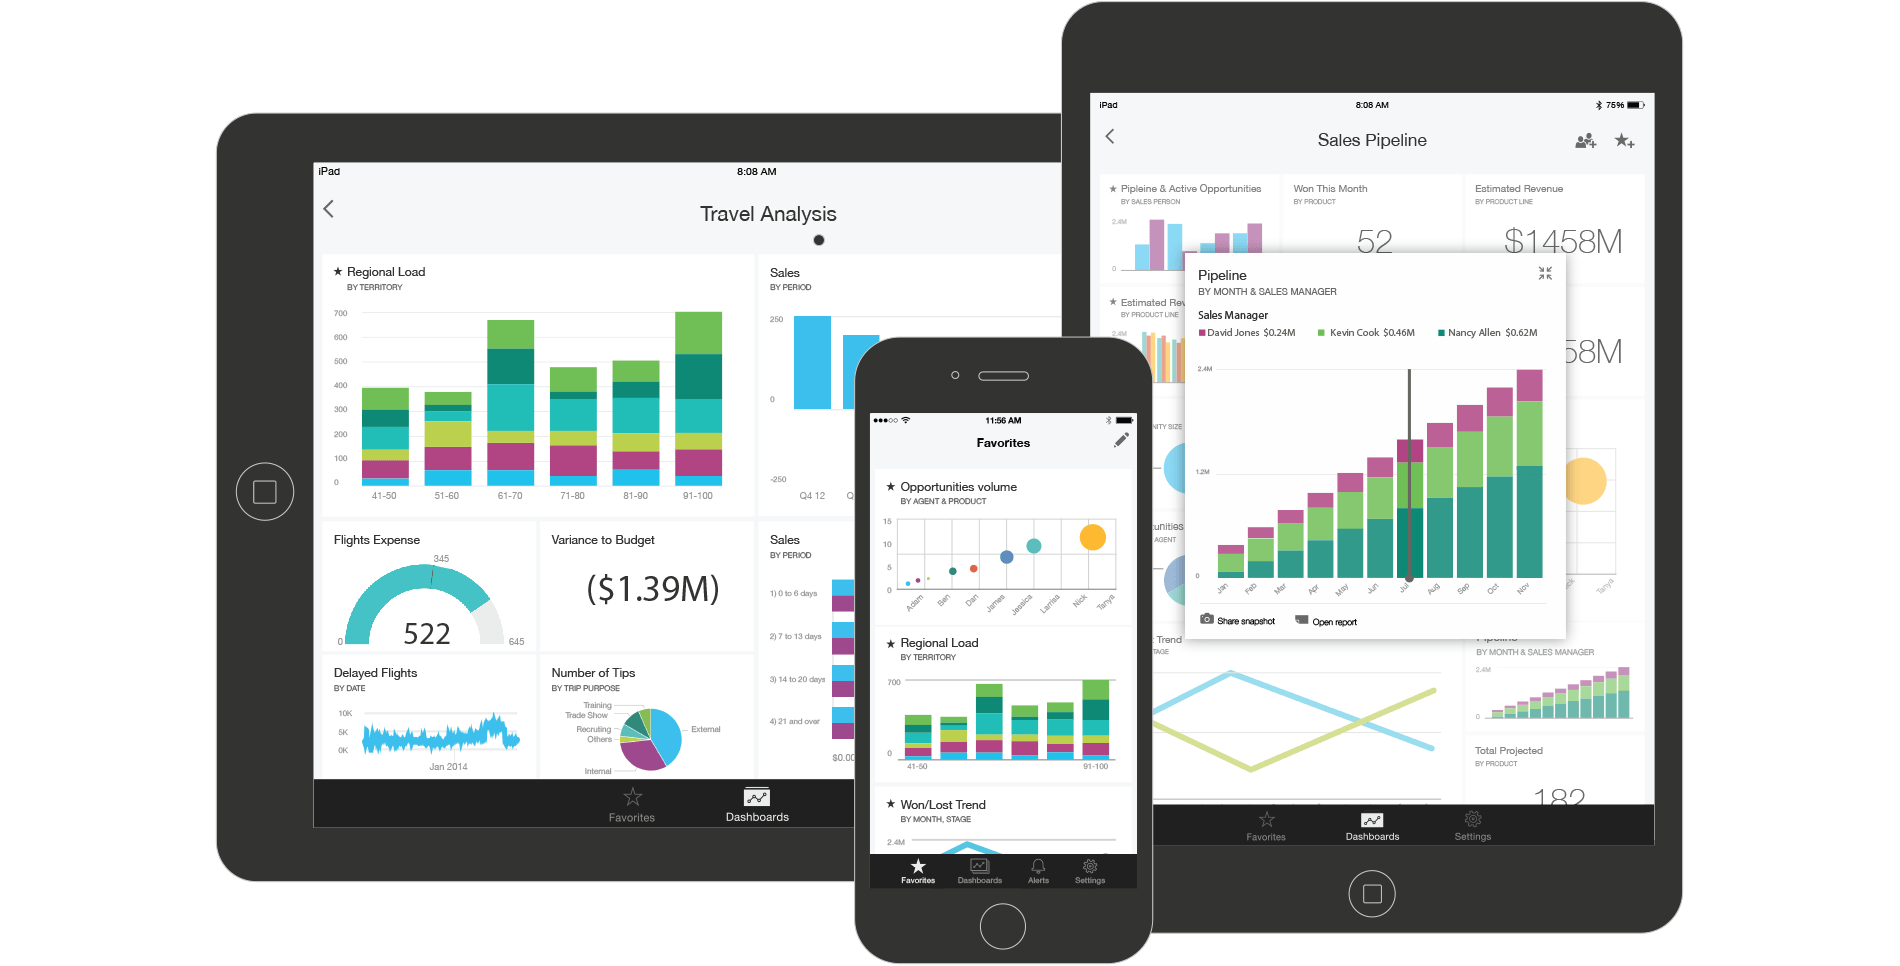
- Power BI mobile apps for Windows, iOS, and Android devices let you view and interact with your company dashboards with live, touch-enabled mobile access.
Beyond those three, Power BI also features two reporting engines:
- Power BI Report Builder creates paginated reports to share in the cloud-based Power BI Service.
- Power BI Report Server supports on-premises report publishing after creating them in Power BI Desktop.

Moving from standard reports to business intelligence
Power BI is an interactive tool you learn to use, just like you did with spreadsheets. Similar to how an analyst might use a spreadsheet to crunch numbers while a salesperson might use it to price proposals, how you use Power BI will depend on your role in a project or on a team.
You might use the Power BI Service to view reports and dashboards. A financial analyst might use Power BI Desktop or Power BI Report Builder to create reports, then publish those reports to the Power BI Service, where you view them. Your salesperson in the field might use the Power BI phone app to monitor sales quotas or follow up on leads. Developers might use Power BI APIs to push data into datasets or embed dashboards and reports into custom applications.
Syncing data sources with Power BI
 When implementing Power BI there is a lot of work in pulling in disparate data sources, synching them to the Power BI Service, establishing relationships between the data, and building key measures and KPIs. Managing all of these connections takes Power BI beyond the skill level of users comfortable with Microsoft Office applications. We recommend letting a developer set up the reporting infrastructure, initial dashboards, and starting reports
TwinEngines can accelerate your Power BI implementation
Here are the steps we take:
- Identifying and connecting to various datasets wherever they may live
- Setting up the infrastructure to get that data into the Power BI Service so it can be consumed by Power BI
- Establishing initial data models, including building relationships between datasets, measurements, and KPIs
- Creating initial reports as reference projects to fast-track your teams’ ability to build their own reports.
- Provide ongoing consultation for the more advanced and challenging aspects of Power BI
Learn how to crunch the numbers
Our next blog post will discuss the many ways to get up and running with Power BI training.
Today’s business intelligence needs to pull from multiple sources to see the big picture. Microsoft’s Power BI offers this capability.
